Statistical Methodology & Mathematical Framework
A transparent disclosure of the algorithms, baseline replacement formulas, and statistical models governing player valuation on Fantasy Team Ranker.
1. The Value Over Replacement Player (VORP) Architecture
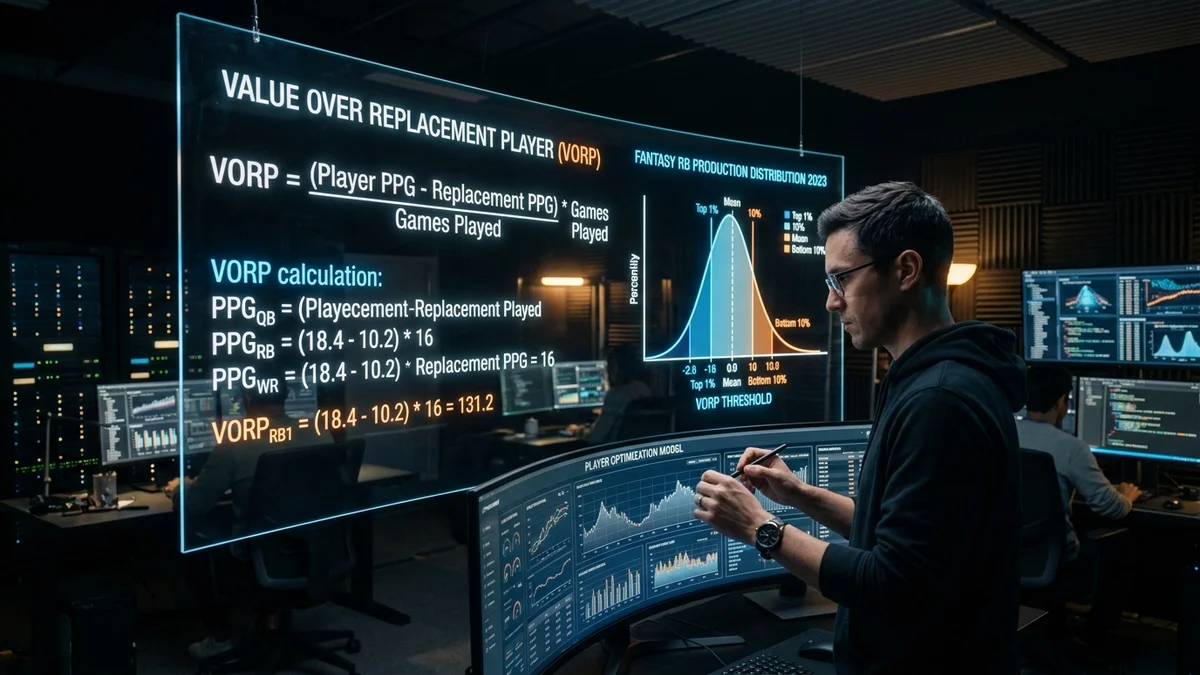
Traditional fantasy football analysis suffers from total-point bias: valuing players strictly by raw fantasy output without considering positional scarcity. In competitive 12-team leagues, point scoring occurs in an environment of bounded roster slots. The primary value of an elite asset is not merely the points scored, but the point differential created over the baseline waiver wire replacement player at that exact position.
VORP(i,p) = ProjectedPoints(i,p) - ReplacementThreshold(p) The replacement baseline (ReplacementThreshold) is defined dynamically according to league roster settings:
| Position | 10-Team Baseline | 12-Team Baseline | 14-Team Baseline | Typical Waiver PPG |
|---|---|---|---|---|
| Quarterback (QB) | QB11 Threshold | QB13 Threshold | QB15 Threshold | 14.2 PPG |
| Running Back (RB) | RB21 Threshold | RB25 Threshold | RB29 Threshold | 10.1 PPG |
| Wide Receiver (WR) | WR31 Threshold | WR37 Threshold | WR43 Threshold | 9.8 PPG |
| Tight End (TE) | TE11 Threshold | TE13 Threshold | TE15 Threshold | 7.4 PPG |
2. Starter vs. Bench Valuation Ratios
Starting lineup slots account for 75% to 80% of total weekly matchup scoring outcomes. Accordingly, bench players cannot be evaluated on an identical scale to weekly starters. Our composite franchise score weights active starters at 75% and reserves at 25% by default.
Bench players are evaluated through three specialized coefficients:
Evaluates backup running backs who inherit bellcow snap shares upon starter injury.
Measures replacement floor reliability during scheduled starter rest weeks.
Credits rookie pass-catchers who historically expand snap shares during the second half of the NFL calendar.
3. Dynasty Positional Age-Curve Polynomial Regressions
In multi-year dynasty formats, future point production decays non-linearly with player age. We model positional depreciation utilizing historical performance datasets across NFL skill players over the past 15 seasons.
| Positional Group | Apex Value Window | Annual Decay Rate (Post-Apex) | Terminal Cliff Age |
|---|---|---|---|
| Running Backs | Ages 22.0 – 25.8 | -18.4% per season | Age 27.5+ |
| Wide Receivers | Ages 24.5 – 28.5 | -9.2% per season | Age 30.5+ |
| Quarterbacks | Ages 26.0 – 32.5 | -4.8% per season | Age 36.0+ |
| Tight Ends | Ages 25.0 – 29.5 | -8.1% per season | Age 32.0+ |
4. All-Play Simulation & The Luck Index
Official head-to-head records frequently misrepresent true team strength due to arbitrary matchup scheduling. To eliminate schedule luck, our Monte Carlo simulation engine computes every franchise's All-Play record by simulating every team playing against all 11 league opponents each week.
The Fantasy Luck Index (FLI) is calculated as:
FLI = Actual Wins - ((All-Play Wins / Total All-Play Games) × Total Weeks) A positive FLI indicates that schedule variance has artificially inflated official win totals, whereas a negative FLI reveals an unlucky high-scoring franchise positioned for positive second-half regression.
Schedule variance has artificially inflated official win totals above expected all-play winning percentage.
Unlucky high-scoring roster due for positive second-half regression toward expected scoring mean.
5. Peer Review & Research Integrity
Our computational models are continuously audited against season-long outcomes to minimize projection variance. Fantasy Team Ranker maintains complete institutional independence: no player ratings are influenced by corporate sportsbooks or player agency sponsorships.